Transportation Data
Different Types of Data used in Transporation Planning
There are a variety of types of transportation data used in the analysis. Some are listed below:
- Infrastructure Status
- Traffic Counts
- Travel Behavior Inventory
- Land Use Inventory
- Truck/Freight Demand
- External/Internal Demand (by Vehicle Type)
- Special Generators
There are different issues related to this data.
- Sample Size,
- Population of Interest
- Sampling Method,
- Error:
- Measurement,
- Sampling,
- Computational,
- Specification,
- Transfer,
- Aggregation
- Bias,
- Oversampling
- Extent of Collection
- Spatial
- Temporal
- Span of Data
- Cross-section,
- Time Series, and
- Panel
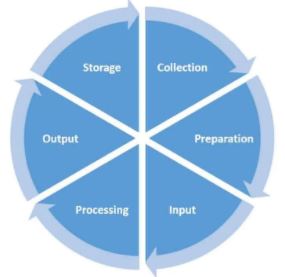
Data Processing Cycle
The data processing cycle consists of a series of steps where raw data (input) is fed into a process to produce actionable insights (output). Each step is taken in a specific order, but the entire process is repeated in a cyclic manner. The first data processing cycle’s output can be stored and fed as the input for the next cycle.
Different Types of Software Tools Used in Transportation Planning
- Data Processing Software
- Data Analysis Software
- GIS Software
- Travel Demand Modeling Software
- Emission and Energy Modeling Software
- Dashboard Software
- Document Automation Software
Data Processing Software
- Data processing is the manipulation of data to produce meaningful information
- E.g. Excel, Open Office, Google spreadsheets, SAS, Matlab, R, and Python
- Open source became more popular
- Cloud-based solutions like Google BigQuery, AWS Redshift are also used by big agencies.
- There are multiple techniques used in processing conversion, validation, sorting, summarization, aggregation, etc.
Data Analysis Software
- Data analysis consists of organization, model building, interpretation of results, and presentation.
- E.g. SAS, STATA, Matlab, R, and Python.
- Machine Learning Models are also part of data analysis.
- Cloud-based solutions like Amazon S3, QuickSight and Google AutoML, etc.
Database Software
A database software or a database management system (DBMS) commonly refers to a tool that is responsible for the creation and management of data. It also allows users to retrieve or update data at a moment’s notice. It helps to optimize, manage, store, and retrieve data stored in databases.
- Microsoft SQL Server and Microsoft Access - License fee-based
- PostgreSQL - Opensource
- MySQL - License fee-based
- Amazon RDS - License fee-based, Cloud-based
GIS Software
A geographic information system (GIS) lets users visualize, question, analyze, and interpret geographical data to help them understand and problem-solve relationships, patterns, and trends. GIS data usually display different kinds of data on one map, to facilitate deep analysis and efficiently use as much data as possible. GIS software usually focuses on gathering, analyzing, and displaying geographical data to manage business operations. GIS can be deployed on-premises or in the cloud.
- Esri ArcGIS - License fee-based, most popular, and cloud option is available too
- Maptitude
- MapInfo
- Google Earth - Opensource
- QGIS - Opensource and powerful
- postGIS - Opensource and powerful
Travel Demand Modeling Software
This software helps to generate future and present transportation demand in cities and states. Specialized regional travel demand models are built using the following models.
- TransCAD
- Cube
- EMME/2/3
- VISUM
Emission and Energy Modeling Software
The energy software models are useful to estimate system-wide transportation energy demand in kWh or billion gasolene spent units; Similarly, emission models are useful to estimate CO2, CO, NOx, PM2.5, SOx, NH3, etc pollutants.
- Califronia-specific EMFAC
- USEPA’s MOVES
- USEPA’s GREET
- USEPA’s VISION
Dashboard Software
Dashboard software allows you to use charts graphs and tables to visually display your data and tell a story to your data analysis and transportation policies. This has become very popular lately due to big data.
- PowerBI - Microsoft’s
- Tableau - License based and very popular
- Improvado - easy to use
- Google Data Studio - Free to use
- Plotly - Open source, R-based
Document Automation Software
Document automation software allows you to convert text-based documents (typically, word-processing files) and PDF forms into powerful productivity tools called templates.
- Overleaf - Opensource
- Docusign - to streamline the agreement lifecycle
- PandaDoc - Scalable and popular and free